

How To Define Retention Metric?
How To Define Retention Metric?
Nothing will work if your product & growth team gets this metric wrong. Qrio retention metric template attached.
Retention is the single most important metric at every stage of the startup. Yet, over 90% of product, growth professionals, and founders get it wrong or ignore it.
Why? Read On!

What is Retention?
How many users remained active (taking core action) within a defined period after signing up? It could be Absolute or percentage.
Why is retention ignored?
It is one of the hardest metrics to move. Retention is fundamental to your business value. This metric is one true proxy of the core value proposition of your product. It is why users come, use, get value and stay with your product. So, if you don’t solve a real need of your users efficiently or better than your competitors then you will have shitty retention. Some day the R-curve will hit X-Axis and it dies.

It is hard for a Founder or Head of Growth or Product to accept that the product is shitty or no one wants it. So a lot of vanity metrics are invented left, right & center to raise funds or earn social currency on various platforms. But for how long? You might need to pivot (sometimes multiple) to fix your retention and pivots can be hard. Hard!
 | by Pete Spano | Medium")
If your product has poor retention then it’s easy to cover it up using vanity metrics and top-of-the-funnel metrics such as DAUs, MAUs, Impressions, App Downloads, App Starts, etc. You can easily end up using the wrong metric to make your retention look good.
Retention is breadth and Engagement is depth to stickiness.
You built a product with good retention but no engagement. If you have a mediocre stickiness then you have breadth but no depth. Simply put - making ‘users active’ isn’t enough. You must check for ‘how active are they?’ It is easy to miss these things.
Not able to understand how retention drives acquisition and monetization. Its impact on CAC: LTV and improving experimentation bandwidth. Very few founders and growth folks understand these concepts truly.
Understanding and solving for retention demands a long-term view. Retention is not about a short-term lift. One can only gauge its impact over a long horizon.

 | by Pete Spano | Medium")
Stages of a Startup and Value of Right Retention Metric
MVP to Early scale Stage (Pre Series A) - Helps you gauge PMF strength.
Early scale stage to Growth stage (Series A to C/D) - Helps in Optimizing for CAC:LTV, Drives acquisition and activation at scale.
Growth to Mature stage (Post Series D) - Helps in scalable and repeatable monetization along with building a defensible brand moat.
The framework to get your retention metric right is just this -
Product Use case & Frequency is the mother of Retention Metric
Key Questions?
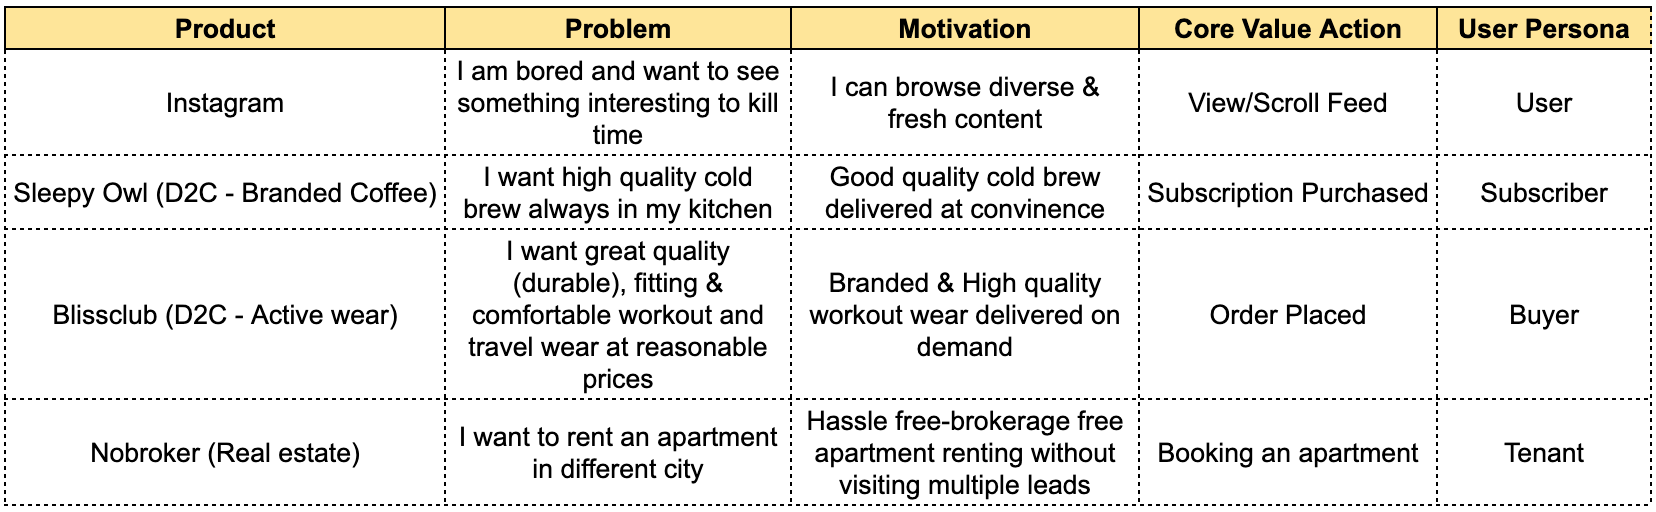
What is the exact problem that your product solves? Define that use case.
Who has the problem that you are solving?
What is the core motivation that user chooses to use your product to get the job done?
What are the alternative solutions available?
What is the natural frequency in which they experience that problem and use alternative solutions?
How to find the retention metric for your product?
Start with a Qualitative approach -
1. User Research- Talking to early users about how often they encounter ‘the problem’ your product solves.
2. Alternative Solution- Check/observe the behavior of your users on the alternative solutions and how often they use it?
Assume, you figure out the problem occurs at least once a week. So you settle on e.g. ‘Weekly Active Users’
Usage behaviour of alternative solutions helps you in hypothesising Natural Frequency.
Ex - I want to get updated about global and local affairs daily and I read newspapers to get the job done. If solved for the same use case on an app, my usage pattern and frequency would be similar. It’d be safe to assume the natural frequency of that use case to be ‘Daily’.
IMP -: This helps you in creating a qualitative hypothesis of your natural frequency. You must calculate the same quantitatively (explained later in this blog)
Natural Frequency hypothesis helps in defining Retention Metric.
Qualitative Hypothesis of Natural Frequency -
Let’s take a few examples -
Now you must validate it quantitatively otherwise you might mistarget your engagement campaigns etc. You will end up notifying, and emailing your users daily or monthly. Too much or too less. You must hit them with the right frequency around the right time for the right use case. Here is how you can validate your hypothesis.
Second your Qualitative Hypothesis with Quantitative Analysis-
Check out for this - What is your usage distribution in the last 30 days? Check for the max/spike in your data.
For Ex -
1. If most users were active for 1-2 days in the last 30 days that means your product has a ‘monthly’ frequency.
2. If most users were active for 3-7 days in the last 30 days that means your product has a ‘weekly’ frequency.
3. If most users were active for 20+ days in the last 30 days that means your product has ‘daily’ frequency.
Now, you need to check if you arrived at the same natural frequency via qualitative and quantitative measures. If not, then either fix your product to align the natural frequency to the quantitative outcome or talk to users more and understand better to arrive at a correct natural frequency (as quantitative).
Next - Validate Qualitative Hypothesis Using Quantitative Analysis
Check for these things -
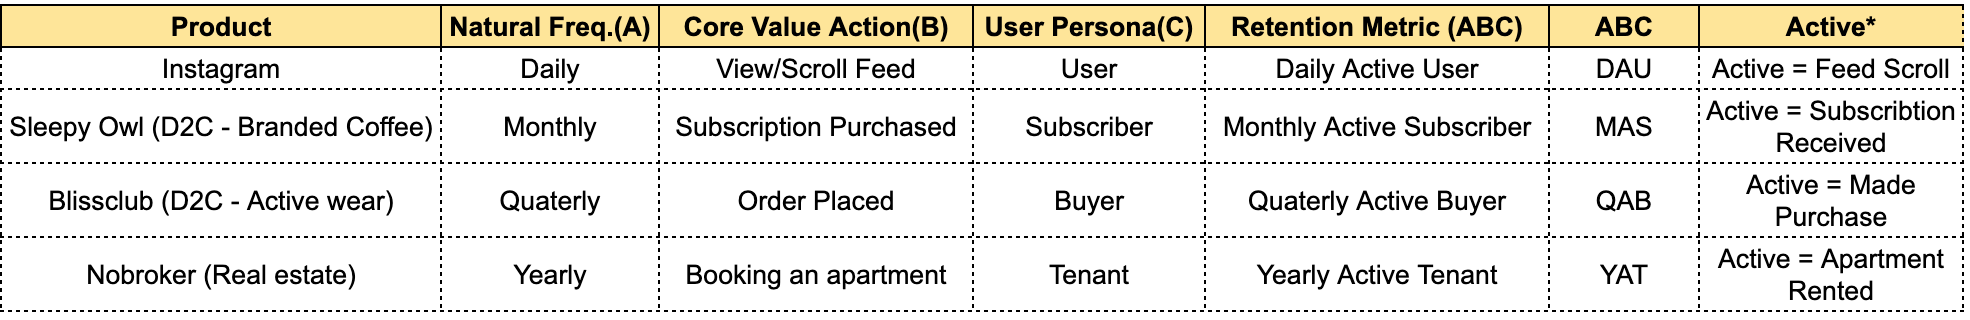
Natural Frequency (A)
Core Value Action (B)
User Persona (C)
1. Natural Frequency -
What is the frequency in which users experience that problem and use alternative solutions?
Quantitative Analysis of NF -
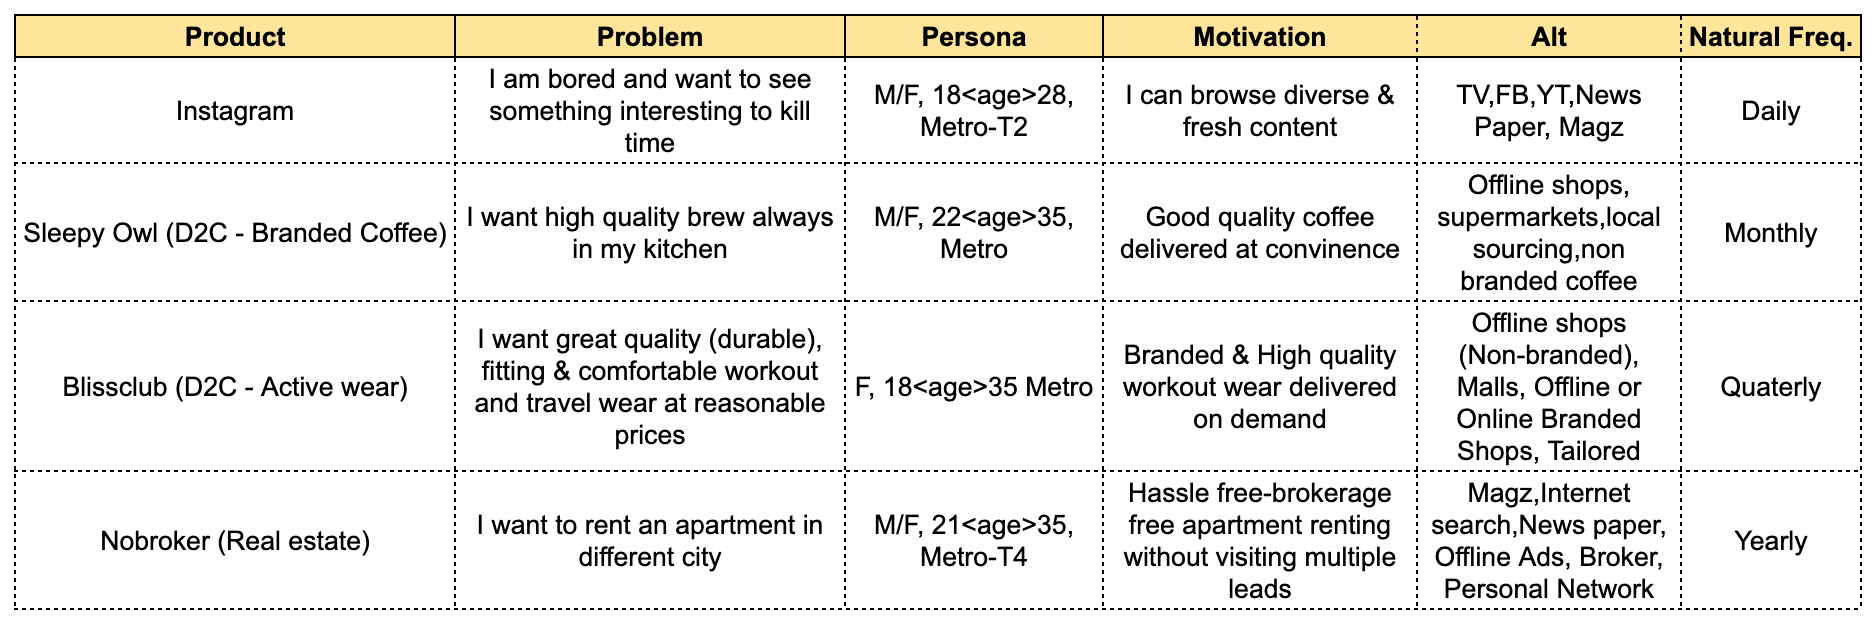
Validate your use case natural frequency - Choose a use case that has active users. Chart the number of active users (Y-Axis) against the number of days they were in the last 30 days (X-Axis).
The above chart shows that the maximum users were active for 28 days of the last 30 days meaning Instagram has a daily use case frequency.
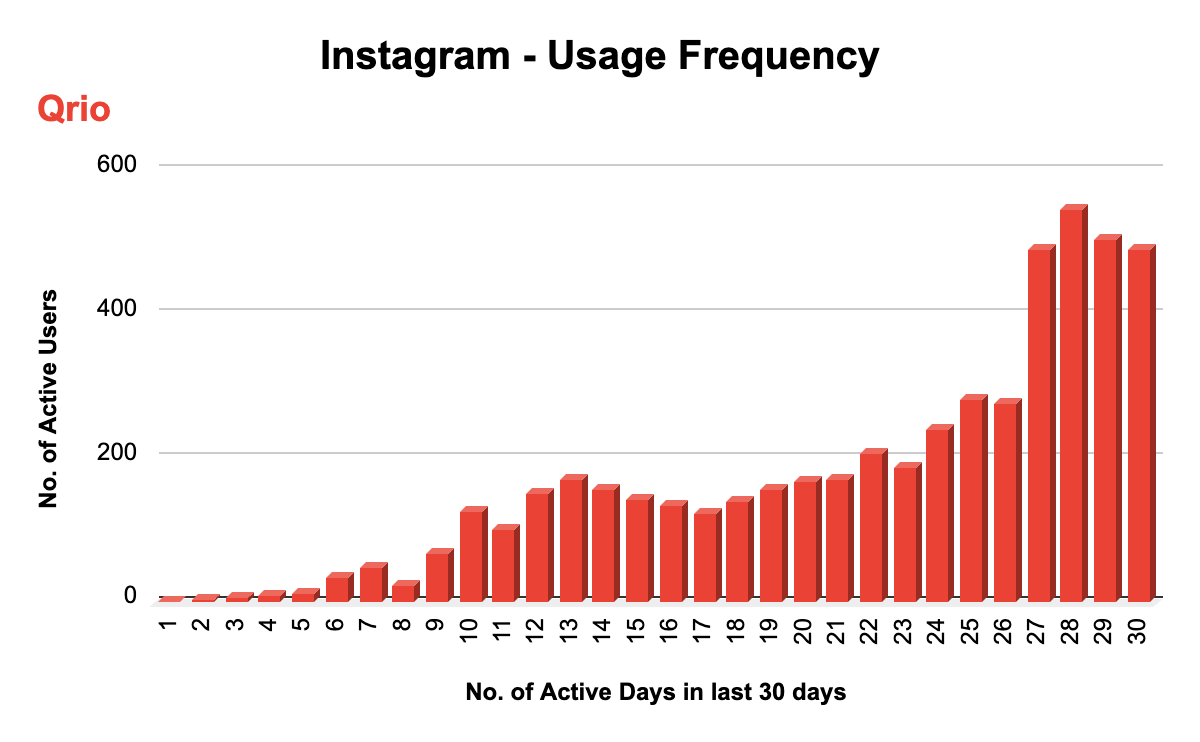
For Sleepyowl, you will see something like this - Assuming they get ~20k+ orders/month (Subscription).
Here - Active user = User who has purchased from the Sleepyowl website.
The above chart shows that the maximum users were active for 1-3 days of the last 30 days meaning Sleepyowl has a Monthly use case frequency. Users are buying coffee monthly.
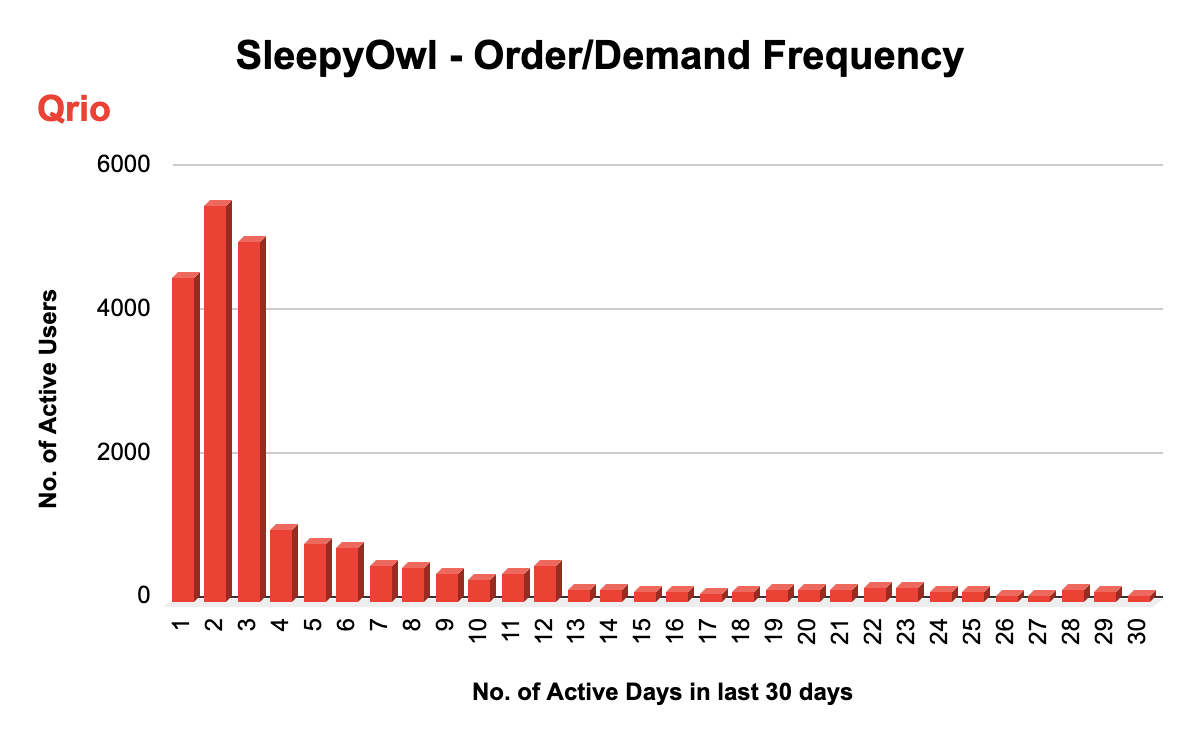
For Blissclub, assuming they are doing approx ~18k+ orders/month.
They would see the max active users congregate for 3-5 months in the last 12 months i.e. Quarterly buying frequency.
I hope you can chart out the frequency for No broker. It’d be a Yearly use case meaning max active users would spike for 1-3 months out of the last 12 months making it a Yearly frequency of use case.
Checkpoint - 1
Your qualitative frequency hypothesis must not differ from the quantitative analysis.
What happens if your quantitative analysis differs from the qualitative hypothesis? This means, there is a sizable gap between the current product and the product vision you had.
What To Do?
Get back to your team and fix the product to ensure it is aligned with the natural frequency(as quantitative) of the problem/use case.
Talk to users more and recheck your qualitative definitions to rebuild an accurate hypothesis.
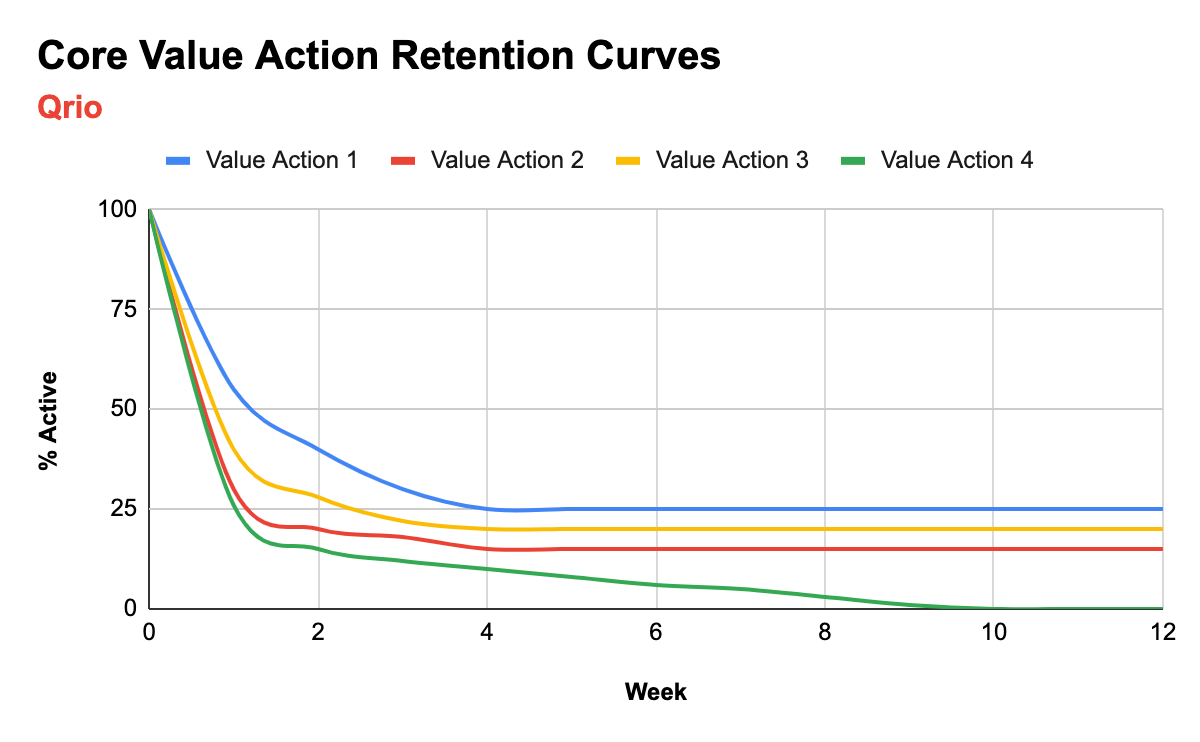
2. Define & Validate Core Value Action -
What action do you want the users to take in your product that represents the value delivered?
Two Imp Caveats -
Some products have more than one value action. For Ex - Sending follow/friend requests, viewing content, likes, comments, sharing, messaging, content creation, etc. You must validate the core value action by plotting retention for each of these features aka feature-based retention.
Validate Qualitative Hypothesis For Core Value Action Using Quantitative Analysis
Choose the core action that leads to the highest and flattening retention. This validates your core value hypothesis.
For Ex - Value Action 1 (Blue) has the flattening and highest retention. Thus it qualifies for core value action.
Value action 4 (Green) is touching the X- axis meaning either users are not finding repeated values in that use case/feature or it serves one-time use cases. You should find time and talk to this cohort asap.

Putting it all together -
Step-1 Define the problem statement and dominant use case of your product.
Step-2 Arrive at the natural frequency of that use case (qualitatively and quantitatively). Defining how frequently the problem occurs? Call it A.
Step-3 Define the core value action. What action do you want the users to take to solve the problem (use case)? Call it B.
Step-4 Who is the user? Who is trying to solve the use case? Call it C.
Retention Metric = NF CVA WHO = ‘ABC’
And, now you are done. You have truly and accurately defined the retention metric for the product. Next week we will learn how to improve retention. Hope you found the blog valuable. Pls, share it across to help others.
Here is the template you can use -
Qrio Retention Template
PS - In this blog, I have talked about user-side retention only. For the marketplace and multisided platform products, a Growth PM must think about the supply-side, and distribution side retention too. Although the framework remains the same.
Note:- Data and visuals used in the blog are only for educational purpose and does not represent the company or its data in any way.
Thanks for reading. See you next week!